By The River Valley Capital Team ·
What Is Trading Risk Management?
Trading risk management is the process of identifying, measuring, and controlling potential losses before and during trading. It determines how much capital is exposed, where a trade becomes invalid, and when trading activity should stop.
Consider two traders, each using a $50,000 account. Trader A risks $2,500 on every position. Trader B risks $250. After four consecutive losing trades, Trader A has lost $10,000, while Trader B has lost $1,000, assuming each trade loses its planned amount.
The difference is not the accuracy of their market predictions. It is the amount of risk each trader accepts when a prediction is wrong. A trading strategy should therefore define risk before evaluating potential profit.
Why Risk Management Matters More Than Win Rate
A high percentage of winning trades does not guarantee profitability. Imagine a strategy that wins 70% of its trades. If the average winning trade earns $100 but the average losing trade costs $300, the strategy loses money over time.
Across 100 trades:
- 70 winning trades generate $7,000.
- 30 losing trades cost $9,000.
- The net result is a $2,000 loss before trading costs.
Now consider a strategy with a 45% win rate, an average gain of $200, and an average loss of $100. Across 100 trades:
- 45 winners generate $9,000.
- 55 losers cost $5,500.
- The net result is a $3,500 profit before trading costs.
These hypothetical examples demonstrate why traders should evaluate both the probability of winning and the financial consequences of losing. The relationship between average gains, average losses, and win rate is commonly described as trading expectancy. A positive historical expectancy can be useful evidence, but it does not guarantee future profitability.
Position Sizing: Decide the Risk Before the Entry
Position sizing determines how much of an asset a trader buys or sells based on the amount they are prepared to lose. A common starting point is to define a fixed percentage of account value as the maximum planned risk for an individual trade.
For example, a trader with a $25,000 account might choose a personal risk limit of 0.5% per trade.
$25,000 x 0.5% = $125
The trader's planned loss should therefore be limited to approximately $125 if the stop-loss executes at the intended price. Suppose a stock trades at $50 and the planned stop-loss is $47.50. The price difference is $2.50 per share.
Position Size = Planned Monetary Risk / Risk Per Unit
$125 / $2.50 = 50 shares
This provides a position size based on the trade's invalidation point rather than an arbitrary number of shares. Actual losses can exceed the planned amount because of slippage, gaps, fees, and execution conditions. For forex, futures, and other leveraged products, position sizing must also account for contract specifications, pip or tick values, and currency conversion where applicable.
Why Fixed Lot Sizes Can Create Inconsistent Risk
Using the same lot size for every trade does not necessarily create the same monetary exposure. A position with a 10-pip stop-loss has a different planned risk from an otherwise identical position with a 40-pip stop-loss. If the position size remains unchanged, the second trade may carry four times the price-distance risk. Risk-based sizing adjusts the position to the stop-loss distance and the instrument's value per unit of movement. You can test these figures quickly with our prop firm calculator.
How Much Should You Risk Per Trade?
There is no universally correct risk percentage. The appropriate amount depends on the trading strategy, account restrictions, historical losing streaks, instrument volatility, and the trader's ability to tolerate losses.
Consider a hypothetical $50,000 account:
- 0.25% risk = $125 per trade
- 0.5% risk = $250 per trade
- 1% risk = $500 per trade
- 2% risk = $1,000 per trade
At 2% planned risk, five full losing trades could create approximately $5,000 of losses if the trader repeatedly sizes positions using the original account value. That may be incompatible with the loss allowance of some prop firm programmes. A trader should therefore consider the available loss buffer, not simply the headline account size.
Stop-Loss Placement: Know When the Trade Is Wrong
A stop-loss is an order intended to close a position when the market reaches a specified price. Its purpose is to define an exit point before a loss becomes unnecessarily large.
However, placing a stop-loss at an arbitrary distance can undermine a trading strategy. A more consistent approach is to identify the price level at which the original trade idea is no longer valid. For example, a trader entering a long position after a breakout might place the stop below a relevant support level, depending on the strategy. The position size can then be calculated around that distance, connecting the market analysis with the planned monetary risk.
Stop-loss orders do not guarantee execution at the requested price. Fast markets, price gaps, and liquidity conditions can produce larger losses.
Risk-to-Reward Ratio: Is the Potential Return Worth the Exposure?
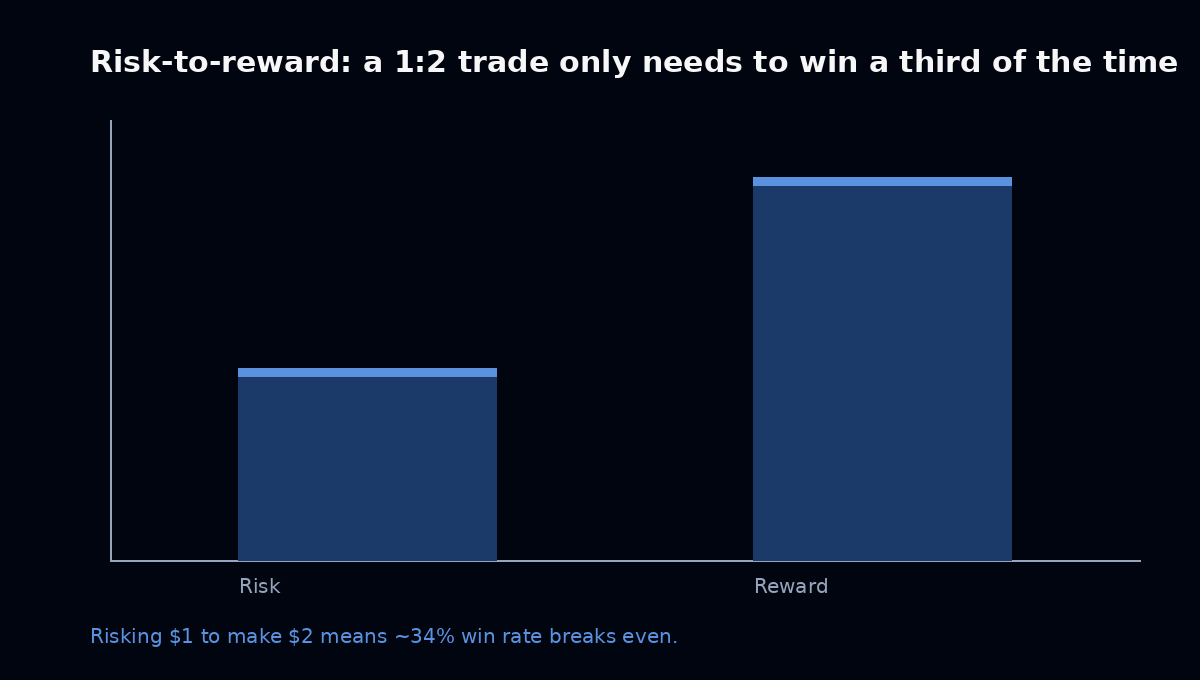
The risk-to-reward ratio compares a trade's planned loss with its potential gain. Suppose a trader risks $100 to target $200. The trade has a planned risk-to-reward relationship of 1:2. A different trade that risks $200 to target $100 has a relationship of 2:1.
Neither ratio independently determines whether a strategy is profitable. The win rate and actual realised results matter. A strategy targeting twice its planned risk can still lose money if too few trades reach their targets. Similarly, a strategy with smaller average winners may be profitable if its win rate is sufficiently high.
The relevant measure is whether the relationship between realised gains, realised losses, and trading costs produces a sustainable positive expectancy over an adequate sample.
Why Losing Streaks Need a Risk Plan
Even strategies with a positive historical expectancy can experience several consecutive losses. Consider a $50,000 account where the trader risks 1% of the remaining balance on each trade. After five consecutive losses, assuming exact 1% losses without additional costs, the balance becomes approximately $47,549.50 - a decline of about 4.9%.
At 2% of the remaining balance per trade, five consecutive losses would produce a decline of approximately 9.6%. This demonstrates how increasing the percentage risk can accelerate account drawdown.
Before trading, consider how the strategy would behave during five or ten consecutive losses. The objective is not to predict the exact length of a future losing streak. It is to establish risk limits that can withstand plausible adverse outcomes without relying on immediate recovery.
Trading Risk Management in Prop Firm Challenges
Prop firm evaluations introduce an important distinction between advertised account size and available loss allowance. A hypothetical $100,000 evaluation account might have a maximum permitted loss of $5,000. That does not mean the trader can safely risk 5% on a single position. Doing so could consume the entire permitted loss allowance before accounting for trading costs or execution risk.
The calculation becomes even more important when the account approaches a drawdown threshold. Suppose a trader has a $102,000 account value but only $1,500 of remaining permitted loss capacity. A $1,000 planned loss would consume a substantial portion of the available buffer, despite representing only about 1% of the headline account size. The trader must therefore consider both the position-level risk and the account-level restrictions.
Put Your Risk Management Strategy to the Test
River Valley Capital offers One-Step and Two-Step challenge options. Review the current profit objectives, drawdown calculations, and trading conditions before choosing a programme.
The Risk Traders Overlook: Multiple Open Positions
A trader can respect the planned risk on every individual trade and still create excessive account-level exposure. Imagine opening three positions:
- EUR/USD: $250 planned risk
- GBP/USD: $250 planned risk
- Gold: $200 planned risk
If all three positions reach their stop-loss levels, the combined planned loss is $700, excluding execution differences and costs. Some positions may also respond to similar economic events. For example, two currency pairs involving the US dollar may move adversely at the same time following a major announcement.
This means individual trade limits should be supported by a separate rule for total open exposure. Before entering another position, calculate how much the account could lose if existing positions move against you together.
A Practical Trading Risk Management Plan
Consider a hypothetical trader with a $30,000 account. The trader chooses the following personal operating framework.
Before the session
- Maximum planned risk per trade: 0.5%, or $150.
- Maximum combined planned exposure: $300.
- Personal daily stopping point: $450 in losses.
- Trades must meet predefined entry and exit criteria.
During the session
The trader calculates position size using the stop-loss distance and instrument specifications. Before opening a second position, the trader checks the risk already committed to open trades. If the combined planned exposure would exceed $300, the new position is reduced or rejected. If the personal daily stopping point is reached, no additional positions are opened.
After the session
The trader records actual results, compares them with planned risk, and identifies any rule violations. This framework is illustrative, not a recommendation that every trader use the same percentages. For a prop firm account, personal limits must be compatible with the provider's official restrictions, including any equity-based loss calculations. You can compare River Valley Capital trading accounts to match a plan to a structure with clearly understood conditions.
Common Risk Management Mistakes
Increasing Position Size After Losses
Trying to recover previous losses through larger positions can accelerate drawdown. The next trade should be sized according to the trading plan, not the amount the trader wants to recover.
Moving Stop-Loss Orders Without a Strategy-Based Reason
Expanding the stop-loss distance after entering a position can increase the original planned risk. Trade-management adjustments should follow predefined rules rather than an emotional response to an adverse move.
Ignoring Trading Costs
Spreads, commissions, swaps, and execution slippage can affect the actual financial result. A strategy that appears profitable before costs may perform differently after them.
Treating Correlated Positions as Independent
Several trades can respond to the same market event. Combined exposure should be evaluated alongside individual position risk.
Confusing Account Profit With Available Drawdown
An account can remain above its starting balance while having limited room above a trailing loss threshold. Understanding that distinction is essential when trading under moving drawdown restrictions. For a technical explanation, see our Trailing Drawdown Guide.
How to Measure Whether Your Risk Management Is Working
Risk management should be evaluated using more than total profit. Useful measures include:
- Average realised loss: Compare actual losses with the amounts planned before entry.
- Maximum drawdown: Measure the largest observed decline from a previous account peak.
- Realised risk-to-reward: Compare average gains with average losses rather than relying only on target ratios.
- Trading expectancy: Evaluate average results per trade over a meaningful sample.
- Rule adherence: Record whether positions followed the intended entry, sizing, and exit conditions.
A profitable period accompanied by repeated rule violations may indicate that the trading process is less controlled than the final account balance suggests. Conversely, a losing period does not automatically mean the risk framework has failed if the losses remained within the planned limits.
Build a Strategy That Can Survive Losing Trades
Trading risk management is not about avoiding every losing position. It is about ensuring that losses remain proportionate, exposure is understood, and decisions are made within a defined framework. Position sizing, stop-loss placement, risk-to-reward analysis, and combined exposure limits work together to protect an account from avoidable damage.
For traders considering a prop firm evaluation, the same principles should be applied alongside the programme's actual loss restrictions. Before selecting a challenge, review the available account structures and determine whether their conditions fit your strategy.