By The River Valley Capital Team ·

What Is a Drawdown in Trading?
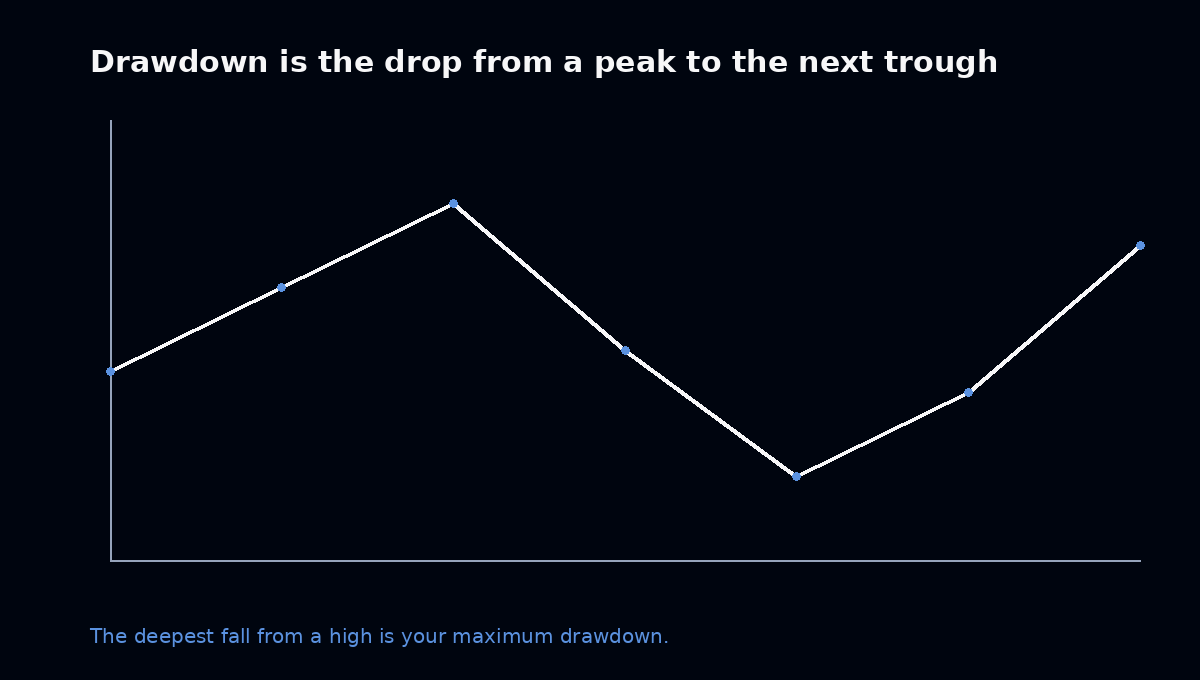
A drawdown in trading is the decline in an account's value from a previous peak to a subsequent lower point. It can be expressed as a monetary amount or a percentage.
Using the opening example:
- Starting account balance: $10,000
- Highest recorded value: $11,200
- Current account value: $10,500
The account has declined by $700 from its previous high. That decline represents a drawdown of 6.25%. Although the account remains profitable compared with its original balance, it has experienced a measurable decline from its peak. This distinction matters because an account can generate positive overall returns while experiencing substantial losses along the way.
Drawdown can be measured using account balance, which generally reflects realised trading results, or equity, which also includes unrealised profit and loss from open positions. The chosen measurement method affects the result.
How to Calculate Drawdown in Trading
The basic drawdown formula compares the account's previous peak with its current value.
Drawdown (%) = (Peak Account Value - Current Account Value) / Peak Account Value x 100
Suppose a trader grows an account from $20,000 to $24,000. After several losing trades, the account falls to $21,000. The calculation is:
($24,000 - $21,000) / $24,000 x 100 = 12.5%
The trader has lost $3,000 from the account's previous high. However, the account remains $1,000 above its starting balance. This is why total account profit and drawdown should be evaluated separately.
Tracking Drawdown Over Several Trades
Imagine an account follows this sequence: $10,000 -> $10,600 -> $11,200 -> $10,900 -> $10,500 -> $11,400. The account initially reaches a peak of $11,200, then declines to $10,500, creating a 6.25% drawdown. When the balance later increases to $11,400, a new peak is established. Any subsequent drawdown is measured from the relevant new high. This approach allows traders to monitor declines throughout a trading history rather than focusing only on the final result.
Drawdown Is Not the Same as a Losing Trade
A losing trade is an individual trading outcome. Drawdown describes a decline in account value from a previous high, which may result from one trade or a series of trades.
Consider two hypothetical situations. Trader A: a $20,000 account loses $100 on one position, representing 0.5% of the starting balance. Trader B: a $20,000 account grows to $24,000 and subsequently falls to $21,000; the account remains profitable relative to its starting value, but the decline from its peak represents a 12.5% drawdown.
Trader B's account has experienced a substantially larger decline from its previous high. This illustrates why drawdown is useful when evaluating performance. Two strategies can generate similar final returns while exposing traders to very different levels of account decline.
Why Maximum Drawdown Matters
Maximum drawdown is the largest observed peak-to-trough decline in an account or strategy over a specified period. Imagine two trading strategies that both finish a year with a 15% return. Strategy A experiences a maximum drawdown of 5%. Strategy B experiences a maximum drawdown of 30%. Their final returns are identical, but their paths are very different: the second strategy required the trader to tolerate a much deeper decline before reaching the final result.
Maximum drawdown can therefore help traders evaluate:
- Capital preservation: How much account value was lost during difficult periods.
- Strategy volatility: Whether returns were achieved through relatively stable performance or substantial fluctuations.
- Risk tolerance: Whether the historical declines are compatible with the trader's financial and psychological limits.
- Recovery requirements: How much growth would be necessary to return to the previous peak.
Historical maximum drawdown does not establish the worst loss that could occur in the future. Market conditions and trading behaviour can change.
Why Recovering From Drawdown Becomes More Difficult
One important characteristic of drawdown is that the percentage required to recover increases as losses become larger. Consider an account starting at $10,000. After a 10% decline, the account is worth $9,000. To recover the original $10,000, the trader needs to generate $1,000 from the remaining $9,000 - an 11.11% gain. After a 20% drawdown, the account falls to $8,000, and returning to $10,000 requires a 25% gain.
| Drawdown | Gain Needed to Recover |
|---|---|
| 10% | 11.11% |
| 20% | 25% |
| 30% | 42.86% |
| 50% | 100% |
These calculations assume no additional deposits, withdrawals, or trading costs. The mathematical relationship explains why limiting severe account declines is an important part of trading risk management.
Drawdown in Prop Trading: Why Account Rules Matter
In a personal trading account, drawdown is primarily a measure of performance and risk. In a prop firm evaluation, drawdown may also determine whether the trader remains eligible to continue.
Prop firms can establish maximum-loss thresholds that participants must respect throughout an evaluation or funded-account arrangement. For example, consider a hypothetical $50,000 evaluation account with a fixed maximum permitted loss of $5,000 from the initial balance. Under this model, the minimum permitted account value would be $45,000. If the monitored account value reaches the prohibited threshold, the trader may breach the programme's conditions.
However, not every provider calculates loss limits in the same way. Some programmes use fixed thresholds, while others adjust the threshold as the account reaches new qualifying highs. The treatment of unrealised losses, daily resets, and account equity can also vary. The advertised drawdown percentage alone is not enough to understand the actual trading restrictions.
Daily Drawdown vs Maximum Drawdown
Daily drawdown and maximum drawdown are related concepts, but they apply to different measurement periods.
Daily Drawdown
A daily drawdown limit restricts losses within a defined trading day or session. The calculation may depend on the account value at a specified reset time, the beginning-of-day balance, or another contractual reference. For example, a hypothetical account might allow a maximum daily decline of $1,000. If the trader reaches that prohibited threshold, the programme may classify the event as a breach, even if the overall account remains above its maximum-loss boundary.
Maximum Drawdown
A maximum drawdown restriction limits losses over a broader period, potentially throughout the entire evaluation. Depending on the programme, the threshold may remain fixed or change as the account grows. A trader can therefore remain within the overall maximum-loss allowance while breaching a stricter daily restriction. The exact reset time, reference value, treatment of open positions, and breach conditions should always be checked in the official programme rules.
Static Drawdown vs Trailing Drawdown
Two common approaches to account-level loss limits are static and trailing drawdown. Static drawdown uses a threshold anchored to a defined reference value. Trailing drawdown can move the loss threshold upward when the account reaches qualifying new highs.
Consider a hypothetical $50,000 account with a fixed $4,000 loss allowance. Under a static model, the floor might remain at $46,000. Under a conventional fixed-dollar trailing model, if the account reaches a qualifying high of $53,000, the floor could increase to $49,000. This changes how much room remains for subsequent losses.
Some programmes also stop the trailing threshold at a specified level, while others use different calculation methods. For a detailed explanation of these mechanisms, read our Trailing Drawdown Guide, and use the prop firm calculator to see how each model affects your remaining buffer.
How Drawdown Affects Prop Firm Account Selection
Drawdown rules should be considered before purchasing a prop trading challenge. A programme may appear attractive because of its advertised account size or profit objective, but its loss restrictions determine how much flexibility the trader has during difficult periods.
Before choosing an account, examine the maximum permitted loss, daily restrictions, calculation method, and treatment of open positions. These conditions can influence position sizing, trading frequency, and the suitability of a strategy. River Valley Capital offers different evaluation structures for traders to compare.
How to Keep Trading Drawdown Under Control
Drawdown cannot be eliminated entirely from a strategy that experiences losses. However, traders can establish controls intended to prevent ordinary losing periods from developing into disproportionately large account declines.
A useful starting point is defining the acceptable loss before entering each trade. Position size should reflect the distance to the planned stop-loss and the amount of capital the trader is prepared to risk. Combined exposure also matters: several positions influenced by similar market conditions can create larger losses than expected when held simultaneously.
During losing periods, increasing position size simply to recover previous losses may accelerate drawdown. A predefined personal stopping rule can help prevent that behaviour. For a broader framework covering position sizing, stop-loss placement, and exposure limits, read our Trading Risk Management Guide.
Understand Your Drawdown Before Choosing a Trading Account
Drawdown reveals something that account profit alone cannot: how much value has been lost from a previous high. For ordinary trading performance, this helps place returns into context. For prop firm evaluations, understanding drawdown becomes particularly important because account-level restrictions can determine whether trading may continue.
Before selecting a programme, review its daily and maximum loss calculations, confirm whether open positions are included, and understand the conditions that trigger a breach. River Valley Capital provides several account structures for traders to evaluate, including an Instant Funding option and a full range of trading accounts.